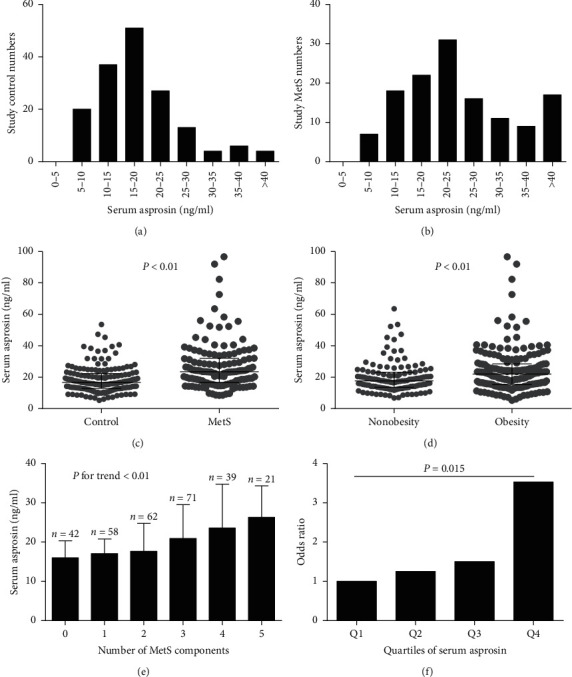
Figure 1.

Serum asprosin levels in the study population. (a) Distribution of serum asprosin levels in 162 control subjects; (b) distribution of serum asprosin levels in 131 MetS subjects; (c) serum asprosin levels in control and MetS subjects; values were provided as median with interquartile range and log-transformed before analysis; (d) serum asprosin levels in the whole study population according to waist circumference (nonobesity: waist circumference < 85 cm in men or 80 cm in women and obesity: waist circumference ≥ 85 cm in men or 80 cm in women); values were provided as median with interquartile range and log-transformed before analysis; (e) serum asprosin levels increased progressively with increasing numbers of MetS components; values were provided as median with interquartile range and log-transformed before analysis; (f) odds ratios for having MetS according to the quartiles of serum asprosin levels (reference, the lowest quartile); Q1: <14.21 ng/mL; Q2: 14.21–19.26 ng/mL; Q3: 19.26–25.79 ng/mL, and Q4: >25.79 ng/mL (Q: quartile).
