
Figure 5.
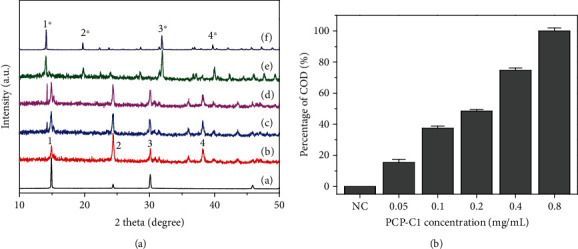
XRD spectrum (a) and COD percentage content (b) of the CaOx crystal formed in the presence of PCP-C1 with different concentrations. (A) 0, (B) 0.05, (C) 0.1, (D) 0.2, (E) 0.4, and (F) 0.8 g/L. The peaks of 1, 2, 3, and 4 belong to (), (020), (), and (130) crystal planes of COM crystals at d = 0.593, 0.364, 0.296, and 0.235 nm, respectively. The peaks of 1∗, 2∗, 3∗, and 4∗ belong to (200), (211), (411), and (213) crystal faces of COD crystals at d = 0.618, 0.442, 0.278, and 0.224 nm, respectively.