Figure 6.

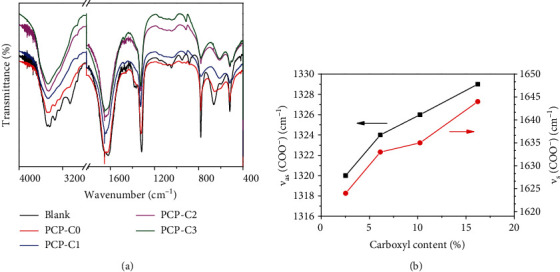
FT-IR spectrum (a) and change of the main absorption peak wavenumber (b) of CaOx crystals generated by regulation in the presence of PCP-Cs with different -COOH contents. c(CaOx) = 0.6 mmol/L.

FT-IR spectrum (a) and change of the main absorption peak wavenumber (b) of CaOx crystals generated by regulation in the presence of PCP-Cs with different -COOH contents. c(CaOx) = 0.6 mmol/L.