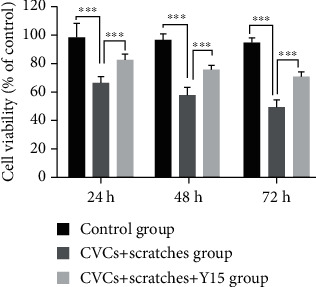
Figure 4.

Effect of Y15 on the cell viability of damaged EA.hy926 cells. Cell viability was detected with MTT assay. Data are presented as the mean ± SD (n = 5 for each time point per group). Two-way ANOVA analysis was performed using the Bonferroni multiple comparison test to determine p values (p < 0.05). ∗∗∗p < 0.001.
