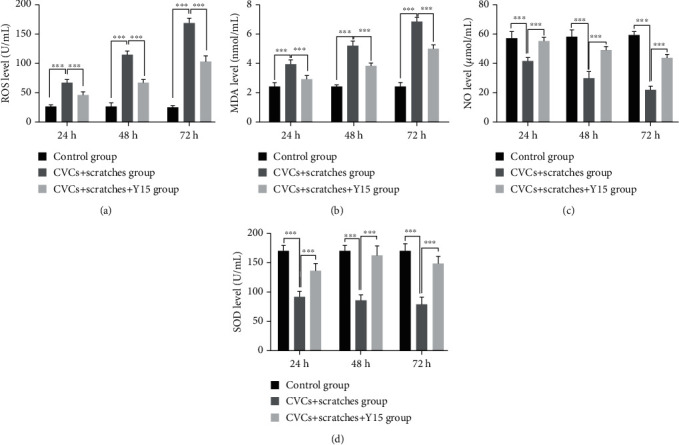
Figure 5.

Treatment of damaged EA. hy926 cells with Y15 decreased ROS and MDA levels and increased concentration of SOD and NO. ROS (a), MDA (b), NO (c), and SOD (d) levels in cells were measured with ROS, MDA, SOD, and NO test kits. Data are presented as the mean ± SD (n = 5 for each time point per group). p values (p < 0.05) were calculated by two-way ANOVA analysis with the Bonferroni multiple comparison test. (a, b) ∗∗∗p < 0.001.
