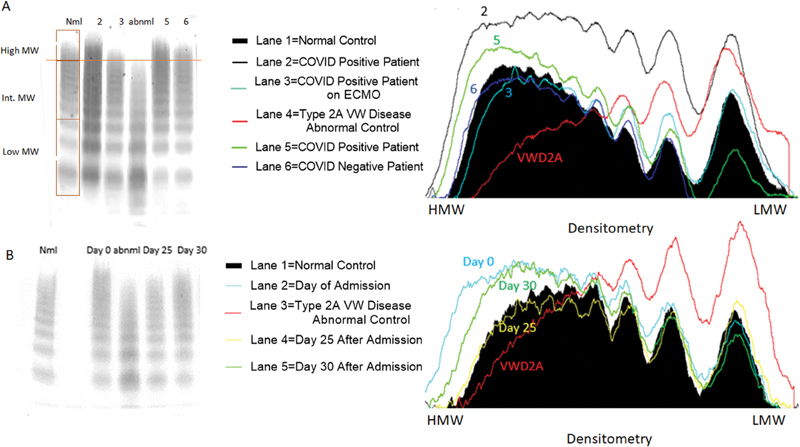
Fig. 1.

Cross sectional and longitudinal analysis of VWF multimers. For each multimer western blot, patient plasma was run on each lane, and the loading of all samples was normalized to measured VWF antigen levels. For each western blot, bands 1–3 were considered low molecular weight multimers, the bands between band 4 and the last band of the abnormal control were considered intermediate molecular weight multimers, and the bands above the last band of the abnormal control were considered HMW multimers. ( A ) The Western Blot to the left shows a pattern of VWF multimer cleavage in five patients. Lane 1 is the negative control, which was derived from normal pooled plasma, and lane 4 is the abnormal control, which was derived from the plasma of a patient with Type II von Willebrand disease. The abnormal control is missing HMW multimers. Lanes 2, 3, and 5 are from COVID-19 positive patients. The patient in lane 6 is from a COVID-19 negative patient with a normal multimer pattern. The COVID-19 positive patients have increased high molecular weight multimers, except for the patient in lane 3 who was on extracorporeal membrane oxygenation at the time of sample collection. The image to the right of the blot is the densitometry of the lanes represented in the western blot. The black filled in area represents the density of the normal control, and the red line indicates the abnormal control. The other lines indicate the densitometry of the multimers of the patients. ( B ) Longitudinal trends of coagulation parameters of a discharged alive COVID-19 patient. Western blot on the left shows the change in HMW multimer patterns throughout this patient's hospital stay. Lane 1 is the negative control and Lane 3 is the abnormal control. Multimer pattern between lane 1 and 2 was blocked as it was derived from an unrelated COVID-19 patient. Lane 2 corresponds to the day of admission, Lane 4 corresponds to day 25 after admission, and Lane 5 corresponds to day 30 after admission. The image to the right of the blot is the densitometry of the lanes represented in the western blot. The black filled in area represents the density of the normal control, and the red line indicates the abnormal control. The other lines indicate the densitometry of the multimers at various timepoints of the patient. Note that by day 25, HMW multimers decreased to normal size. COVID-19, coronavirus disease 2019; HMW, high molecular weight.
