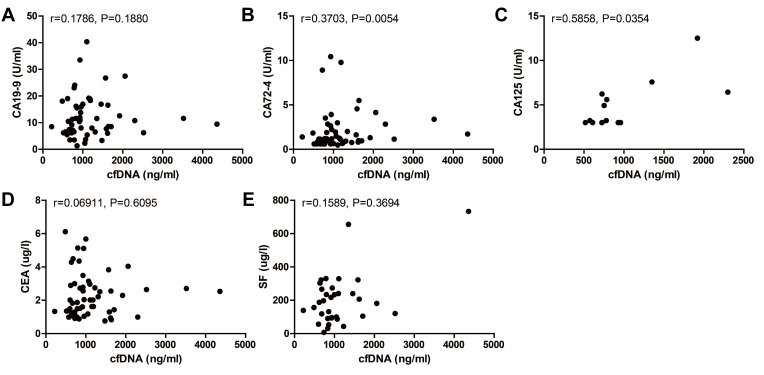
Figure 4.
Correlation between cfDNA concentration at baseline and levels of other circulating biomarkers including CA19-9 ((A), n=56, r=0.1786, P=0.1880), CA72-4 ((B), n=55, r=0.3703, P=0.0054), CA125 ((C), n=13, r=0.5858, P=0.0354), CEA ((D), n=57, r=0.06911, P=0.6095), and SF ((E), n=34, r=0.1589, P=0.3694).

