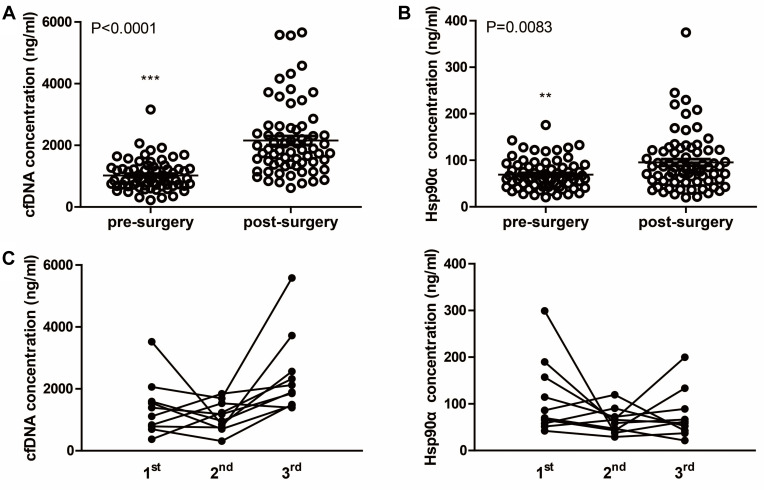
Figure 6.
Concentrations of plasma cfDNA and Hsp90α before and after surgery. (A) Scatter plot of cfDNA concentrations before and after surgery. (B) Scatter plot of Hsp90α concentrations before and after surgery. (C) Dynamic monitoring of cfDNA and Hsp90α concentrations in 10 ESCC patients who received chemotherapy and underwent curative resection successively. 1st, 2nd and 3rd mean different time points of detecting as showed in Figure 1. **P < 0.01, ***P < 0.001.

