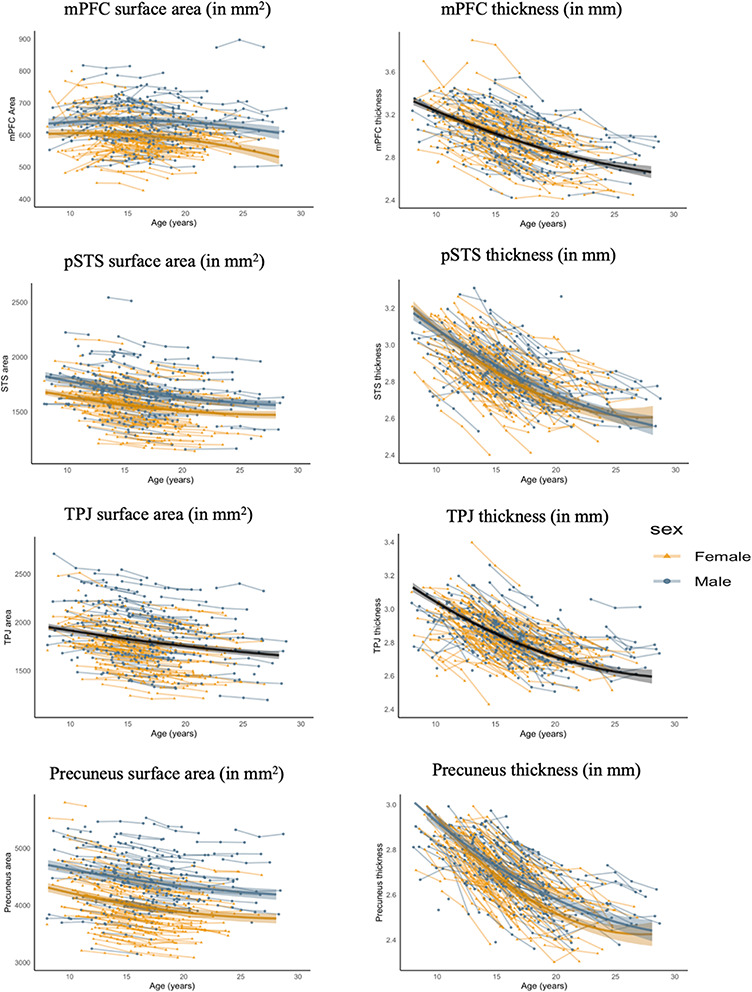
Fig. 2.

Observed individual trajectories for each region of interest. mPFC = medial prefrontal cortex; pSTS = posterior superior temporal sulcus; TPJ = temporoparietal junction. Estimated population trajectories for each gender are shown by coloured lines. If no gender differences were present, we plotted the average developmental trajectory across gender in solid black lines. The shaded areas represent the 95% confidence intervals.
