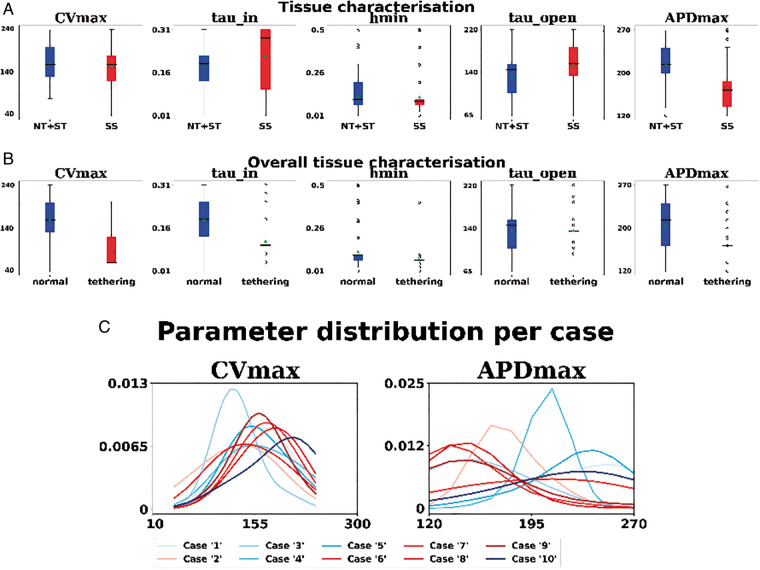
Figure 4.
(A) Box plot of the parameters for cases presenting self-sustaining AF/AT (red) and either self-termination or non-triggering. (B) Box plot of the model parameters for a substrate with PS (red) and the other tissue (blue). Circles represent outliers. (C) Distribution of CVmax (cm2/s) and APDmax (ms) for each clinical case. Red colour scale identifies cases with self-sustaining activation pattern; blue colour scale identifies cases with self-terminating/not triggering pattern. AF, atrial fibrillation; AT, activation time.

