Figure 3.
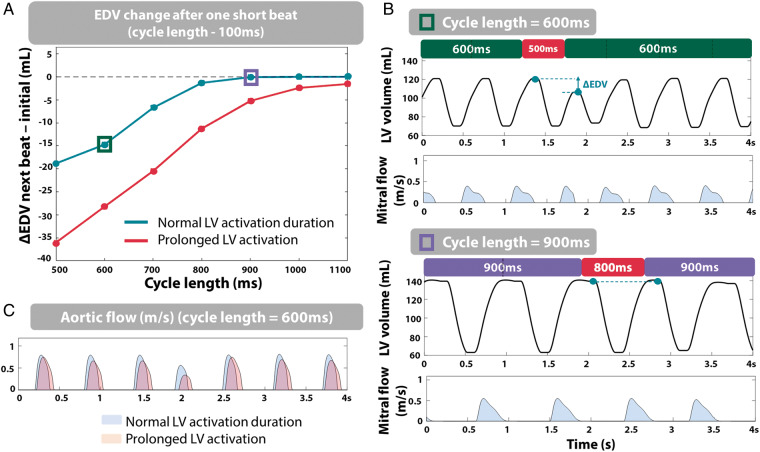
(A) Deviation of LV EDV from initial EDV (mL) after a short beat (RR-interval—100 ms) for varying CL, in the case of normal systolic duration (green) and prolonged LV activation duration (red). (B) LV volume and mitral flow pattern traces at CL = 600 ms (top) and 900 ms (bottom). (C) Aortic flow at CL = 600 ms for normal LV activation duration (blue) and prolonged LV activation duration (orange). CL, cycle length; EDV, end-diastolic volume; LV, left ventricle.

