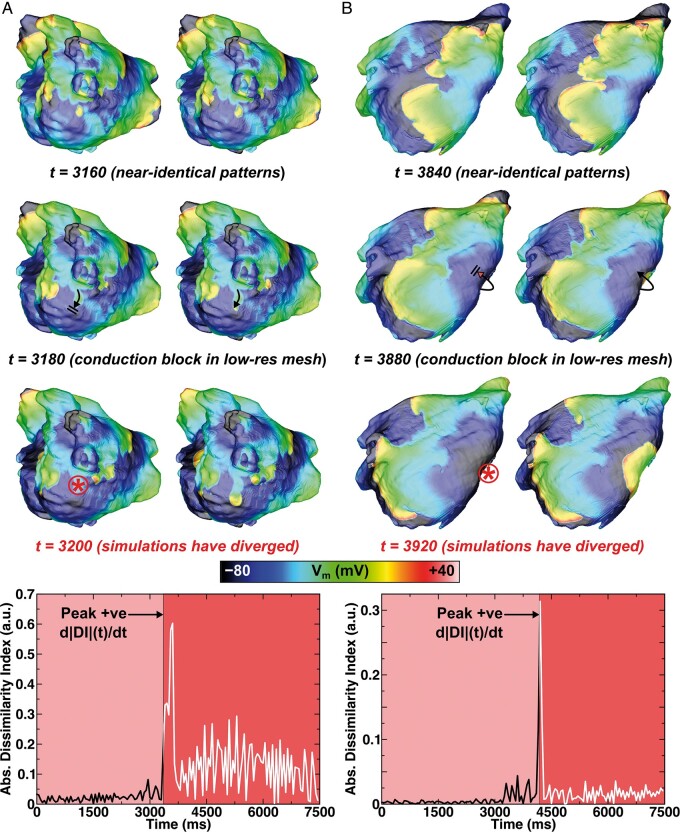
Figure 2.
Analysis of the instants at which electrophysiological behaviour diverges during simulated pacing of low- and high-resolution models. Top rows show maps of Vm in low- and high-resolution models (left and right, respectively) at relevant time points before, during, and after conduction block events leading to divergence. Time intervals before and after the peak positive d|DI|(t)/dt are shown. (A) In Patient 1, pacing from Site #7 led to initiation of RD1 in low-resolution model and RD4 in high-resolution model. Following the delivery of the final stimulus (at t = 2950 ms), critical conduction block occurred in the low-resolution model leading to divergence at t = 3180 ms. See Supplementary material online, Video S2 for a dynamic illustration of Vm over time for this case. (B) In Patient 4, pacing from Site #3 led to initiation of RD3 in low-resolution model and RD1 in high-resolution model. The instant of relevant conduction block in the low-resolution model was at t = 3880 ms. See main text for anatomical descriptions of rotor locations. RD, re-entrant driver.

