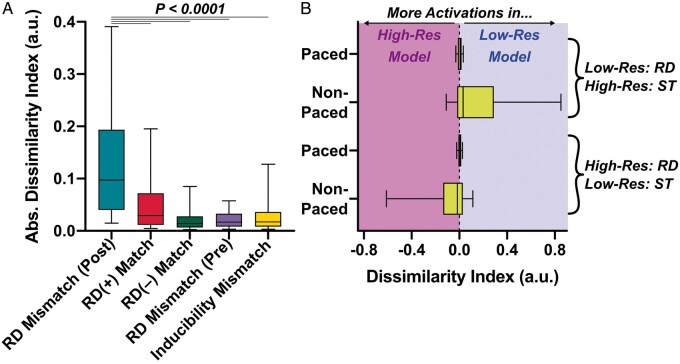
Figure 3.
Analysis of aggregated |DI| values across all simulations in low- and high-resolution versions of all patient-specific models. (A) |DI| values are presented for several different groups of results; data shown are medians, lower/upper quartiles, and 10th/90th percentiles. RD(±) match (Column 1) includes |DI| values [median (inter-quartile range) = 0.0292 (0.0114–0.0718)] for all simulation pairs (n = 43 cases, from 0 to 7500 ms) in which rapid pacing from a particular site led to the initiation of the same RD in both meshes. RD(–) match (Column 2) shows |DI| values [0.0140 (0.00650–0.0279)] for cases where pacing did not induce any reentry in either the low- or high-resolution model (n = 197, from 0 to time of first ST). Inducibility mismatch (Column 3) shows |DI| values [0.0173 (0.00801–0.0361)] for cases where pacing led to RD initiation in one mesh and ST in the other (n = 61; from 0 to ST time in the non-inducible model). Finally, RD mismatch (pre/post) (Columns 4/5) show |DI| values from the intervals preceding [0.0170 (0.00824–0.0328)] and following [0.0973 (0.0403–0.193)] the instant of largest increase (i.e., peak positive d|DI|/dt) in simulations where pacing from the same site led to initiation of RDs in different locations (n = 61); Pre-/post-intervals correspond to the same-coloured areas in |DI|(t) plots from Figure 2. As indicated by asterisks, data sets in the first four columns all differ significantly from the 5th column (P < 0.0001, Dunn’s multiple comparisons test). (B) Summary plots (same box-and-whisker settings as A) of non-normalized DI(t) during and after rapid pacing. Data are subdivided into cases where an RD only occurred in the low-resolution model (top rows; n = 43) or the high-resolution model (bottom rows; n = 18). RD, re-entrant driver; ST, spontaneous termination.

