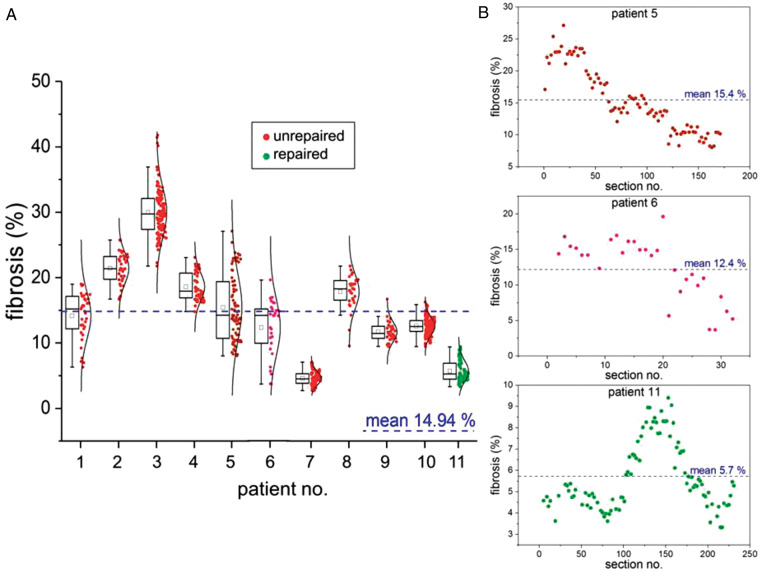
Figure 3.
Inter- and intra-individual variability of percent fibrosis in histology sections. (A) Large inter-individual differences are seen between samples (ranging from 4.59% mean fibrosis in Patient 7 to 29.98% in Patient 3), as well as large intra-individual variability between sections of one and the same patient sample (average intra-individual difference in fibrosis levels is 11.07%). Note that the inter-individual differences of mean fibrosis levels in 10 out of 11 patient samples are no larger than those seen between individual sections intra-individually, arguing strongly against the use of single histology sections for patient fibrosis assessment. Box plots indicate 25th–75th percentile, whiskers indicate the outermost data point that falls within upper inner and lower inner fence [defined as 75th percentile + (1.5 × interquartile range) and 25th percentile − (1.5 × interquartile range), respectively], median and mean presented by line and small box, respectively. Single data points for each section of RVOT samples from unrepaired (red/lilac) and repaired (green) TOF patients are accompanied by distribution curves. (B) Different extent of fibrosis across three stacks of analysed histology sections from individual RVOT tissue samples (Patients 5, 6, and 11). RVOT, right ventricular outflow tract; TOF, tetralogy of Fallot.

