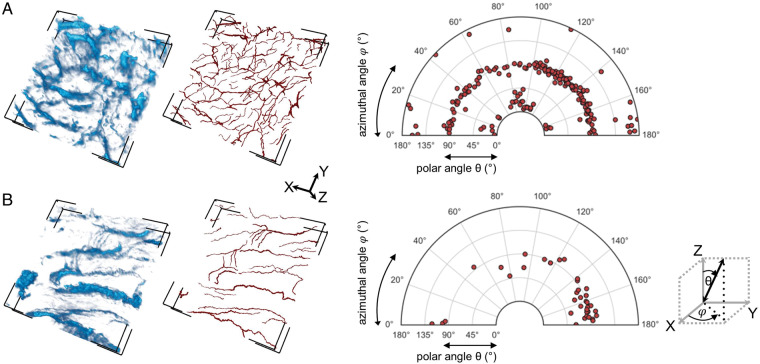
Figure 4.
Collagen fibre orientation analysis in SHGI data. (A) and (B) show the raw SHGI data (left panels), and the semi-automatically traced collagen fibres (middle panels) in two exemplary SHGI volumes. Volume dimensions in x, y, and z were 442.86 µm × 442.86 µm × 94.34 µm and 442.86 µm × 442.86 µm × 108.76 µm for Volumes A and B, respectively. The right panels present the analysis of in-plane x–y-alignment (represented by φ) and out-of-plane orientation (represented by θ) of individual collagen fibres; the Cartesian co-ordinates were aligned corresponding to the image volume orientation. This shows a relatively homogeneous, anisotropic distribution in Volume A, and a more parallel, isotropic distribution in Volume B. SHGI, second harmonic generation imaging.

