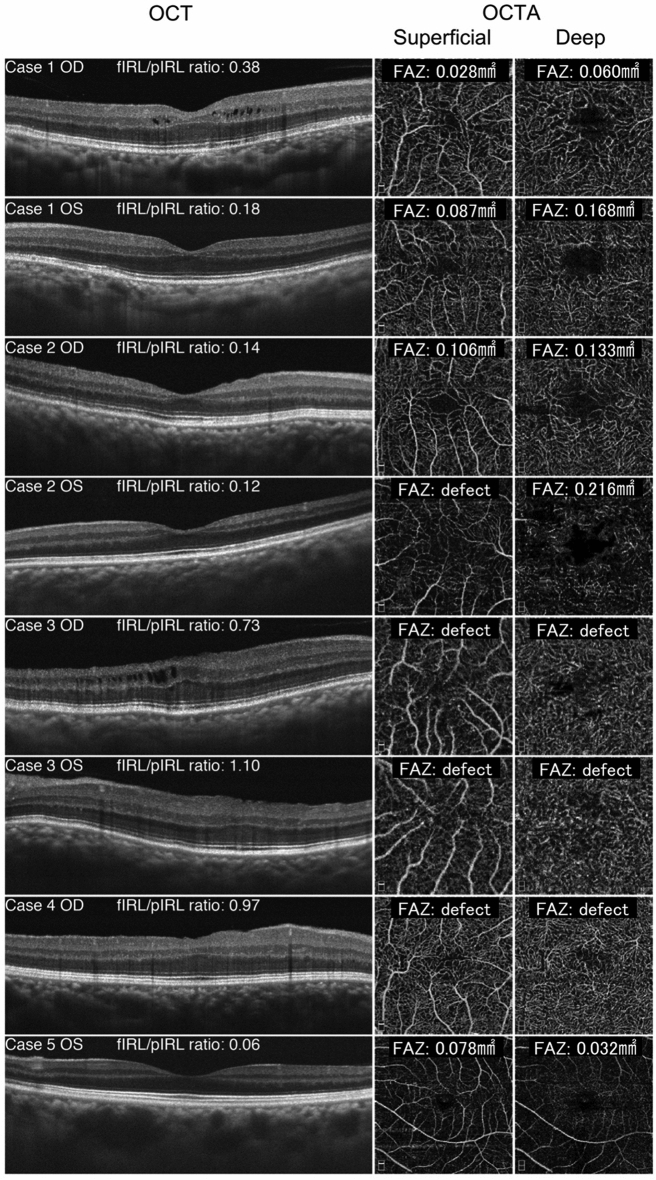
Fig. 1.
Comparison of the cross-sectional optical coherence tomography (OCT) images (left) and optical coherence tomography angiography (OCTA) images of the superficial (middle) and deep (right) capillary plexuses from all eight eyes. The thickness of the foveal inner retinal layer (fIRL) and parafoveal inner retinal layer (pIRL), in addition to the area of the foveal avascular zone (FAZ), were all measured manually. Subsequently, fIRL/pIRL ratio was calculated and the size of FAZ area was corrected by axial length

