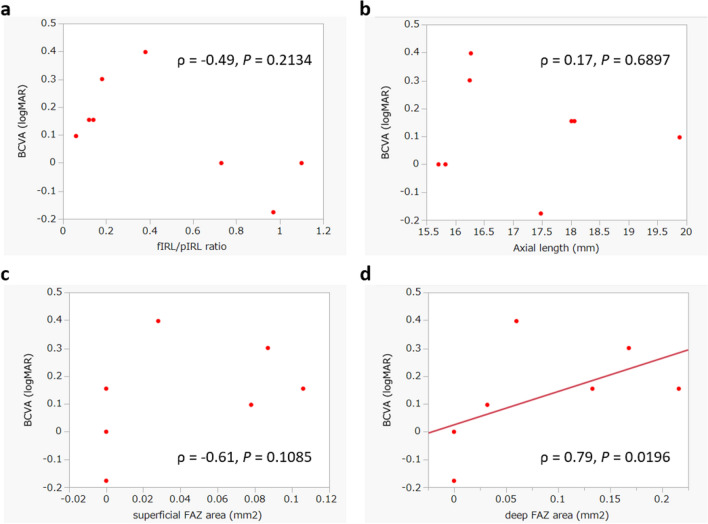
Fig. 2.
Correlations between the visual acuity (logMAR), the fIRL/pIRL thickness ratio, the axial length, and the size of superficial and deep FAZ. Correlations were computed using Spearman’s rank correlation coefficient. The correlation between a the visual acuity and the fIRL/pIRL ratio, between b the visual acuity and the axial length and between c the visual acuity and the size of superficial FAZ were not significant, whereas the correlation between d the visual acuity and the size of deep FAZ (ρ = 0.79, P = 0.0196) was significant

