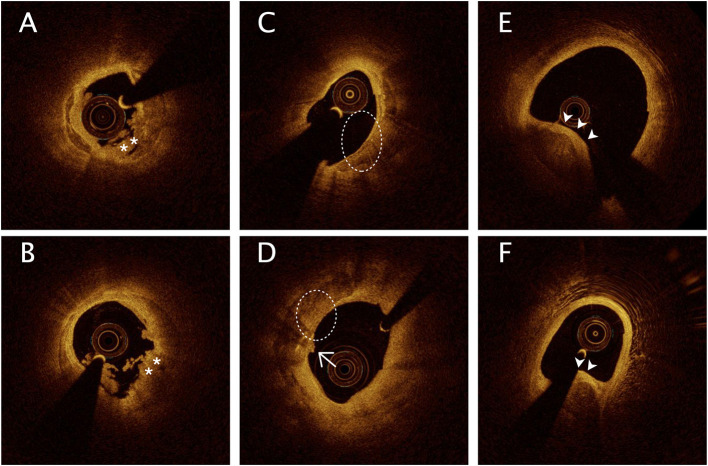
Figure 2.
Representative optical coherence tomography images of calcification in culprit lesion segments. (A,B) Eruptive calcified nodules with thrombus into the lumen (*). (C,D) Superficial calcific sheet (dashed circle) or accompanied by thin fibrous tissue (D, arrows). (E,F) Calcified protrusion represents protruding calcific into the lumen (arrowheads).

