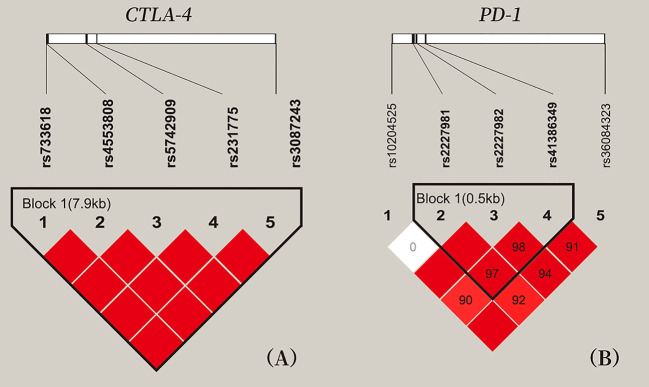
Figure 1.
Location and pair-wise linkage disequilibrium values of CTLA-4 and PD-1 SNPs in all study participants. (A) These five SNPs span 7 kb of CTLA-4 gene region. (B) These five SNPs of PD-1 gene region. Values of the pair-wise D' (×100) are shown in blocks (D' values of 1.0 are not presented). Haplotype blocks were estimated with the Haploview program.

