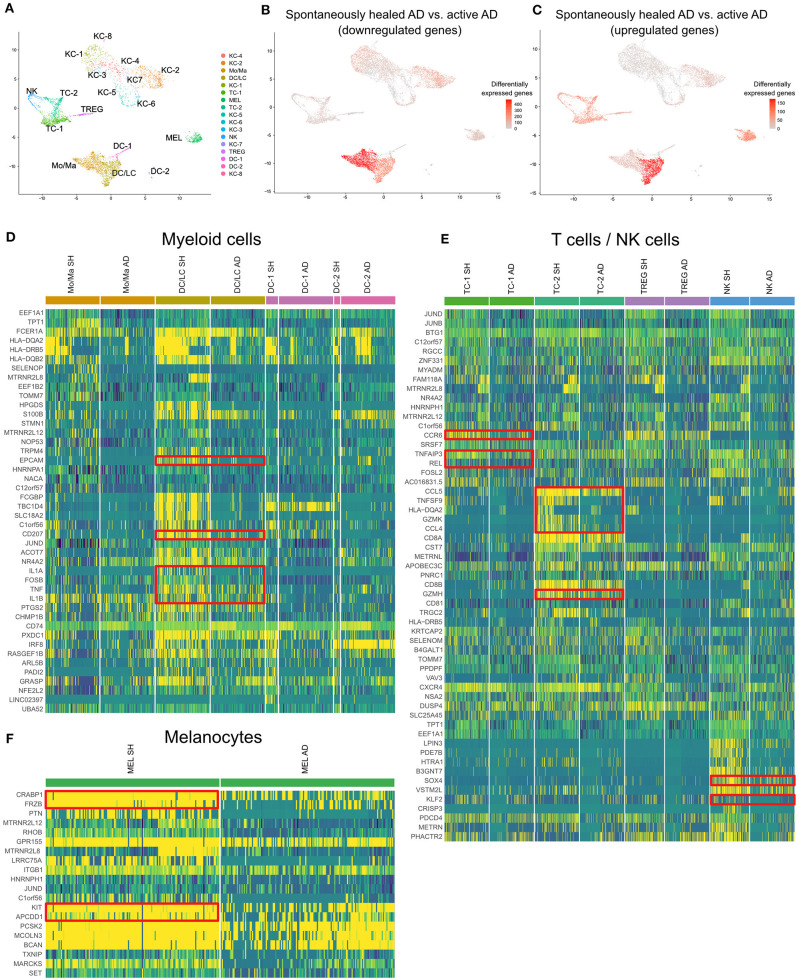
Figure 4.
scRNA-seq map of skin cells from suction blister samples of spontaneously healed atopic dermatitis and active AD lesions. (A) UMAP of 14,443 cells integrated from spontaneously healed atopic dermatitis patients (n = 4) and active AD samples (n = 4) according to similarity of their transcriptome, resulting in 17 different color-coded clusters. (B,C) Number of differentially expressed genes (DEGs) within each cluster comparing spontaneously healed AD with active AD samples, separately for up- and downregulated DEGs, projected onto UMAP plots. Differential gene expression was defined as log fold change >|0.25| and adjusted p < 0.05 as calculated by logistic regression and Bonferroni correction. (D–F) Expression heat map of the top 20 upregulated genes in spontaneously healed AD compared to AD samples in the respective cell clusters. Upregulation is indicated in yellow, downregulation in blue. Cell numbers in heat maps were downsampled for better comparability of clusters. AD, Atopic dermatitis; KC, Keratinocytes; Mo/Ma, Monocytes/Macrophages; LC, Langerhans cells; TC, T lymphocytes; MEL, Melanocytes; NK, NK cells; TREG, regulatory T lymphocytes; DC, Dendritic cells; SH, Spontaneously healed; HC, healthy controls; UMAP, Uniform Manifold Approximation and Projection.

