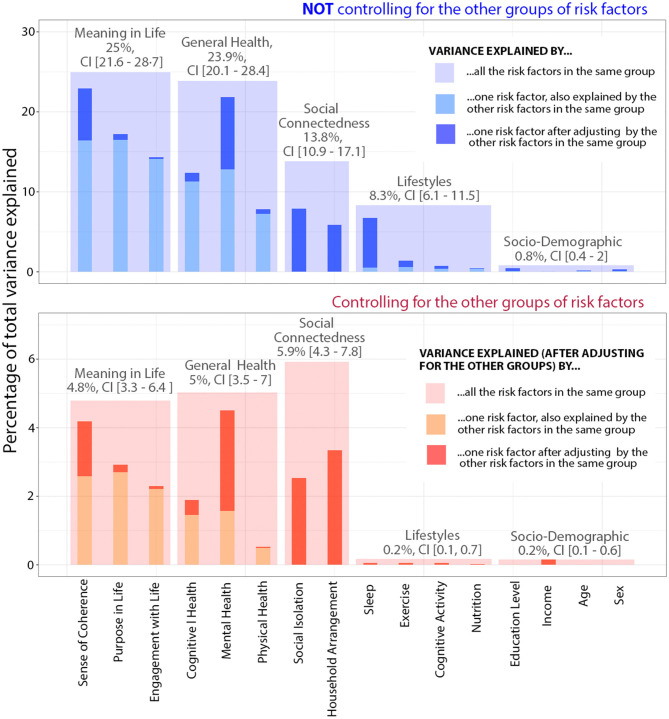
Figure 1.
Proportion of variability in loneliness explained by different risk factors in models with different number of controlling factors. The full model including all risk factors classified in five conceptually distinct groups (including 16 factors) was able to explain a total of 37.87% of the variability in loneliness levels [adjusted R2 = 37.31%, CI (34.40%, 41.75%)].

