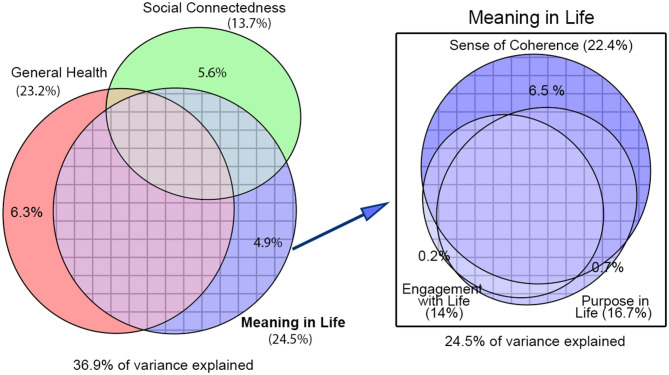
Figure 2.
Elliptical Venn diagrams with overlapping and non-overlapping areas proportional to the total variance in loneliness explained by each group of risk factors. Figures in parentheses correspond to the explained variance when we do not control for the other risk factors represented (total area of the ellipses). Figures without parentheses correspond to the variance when we control for them (non-overlapping areas of the ellipses). Socio-demographic factors have always been partialed out to account for sampling selection biases in our study.

