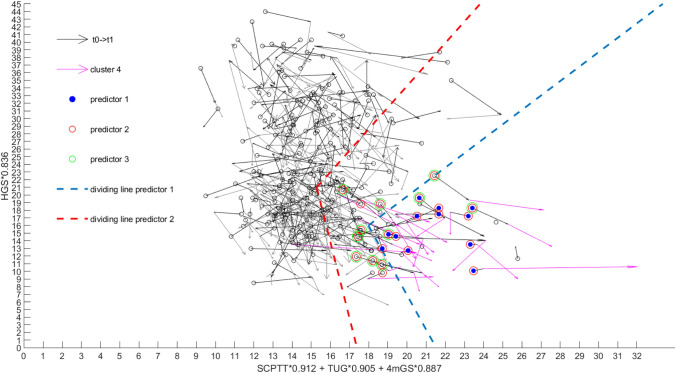
Fig. 2.
Vector graph showing physical function at all three time points. The relevant cluster is presented (t1–t2) in magenta. Dividing lines of predictor 1 and 2 are shown in blue (predictor 1) and red (predictor 2). In accordance to the legend the identified subjects of the three predictors are presented in different colors. As predictor 3 is defined as predictor 2 with the additional condition of negative delta values from t0 to t1, no extra dividing lines are able to present. Identified subjects of predictor 2 (n = 22) involve those of predictor 1 (n = 12); predictor 3 is a subset of predictor 1 and 2 (n = 11)

