Fig. 1.
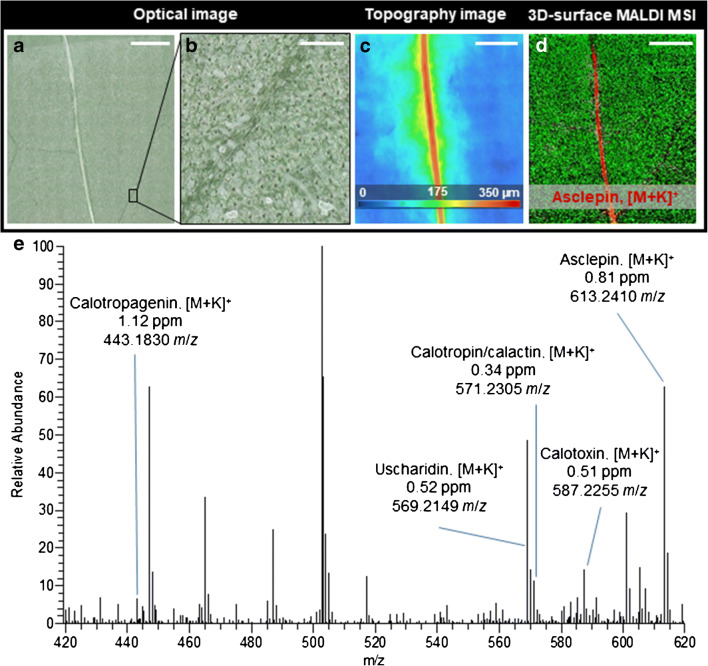
3D-surface MALDI MS imaging of an intact A. curassavica leaf. a Optical microscope image of the leaf surface after measurement. b Magnification (× 8) showing laser ablation spots on the leaf surface. c Topography image of an intact A. curassavica leaf surface showing height variations of up to 350 μm (leaf height varies from ‘cold’ (blue) to ‘hot’ (red). d Red-green overlay MS image of asclepin (m/z 613.2410, [M + K]+, red) and disaccharide at (m/z 381.0793, [M + H]+, green). e Single pixel mass spectrum for mass range m/z 420–620, obtained from the vein area of the leaf. Six different cardenolides are labelled with measured mass-to-charge-number ratio, compound name and mass deviation. MS images were generated with 178 × 178 pixels, 45 μm pixel size, m/z bin width: Δ(m/z)/m/z = ± 5 ppm. The scale bars are a, c, d 1 mm and b 150 μm

