Fig. 2.
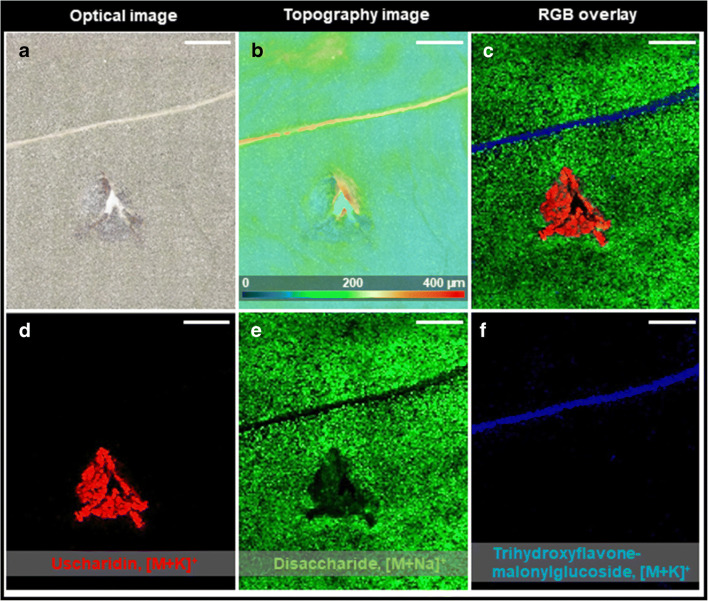
3D-surface MALDI MS imaging of an injured leaf of A. curassavica after 1 h. a Optical microscope image of the leaf surface after measurement. b Topography image of the leaf surface. The injured parts are showing height differences up to 400 μm. c RGB overlay of ion images showing the spatial distribution of uscharidin (m/z 553.2411, [M + K]+, red), disaccharide (m/z 365.1056, [M + Na]+, green), and trihydroxyflavone-malonylglycoside (m/z 557.0692, [M + K]+, blue). d Single ion image of uscharidin (m/z 553.2411, [M + K]+). e Single ion image of disaccharide (m/z 365.1056, [M + Na]+). f Single ion image of trihydroxyflavone-malonylglycoside (m/z 557.0692, [M + K]+). MS images were generated with 143 × 171 pixels; 35 μm pixel size; m/z bin width: Δ(m/z)/m/z = ± 5 ppm. All scale bars are 1 mm

