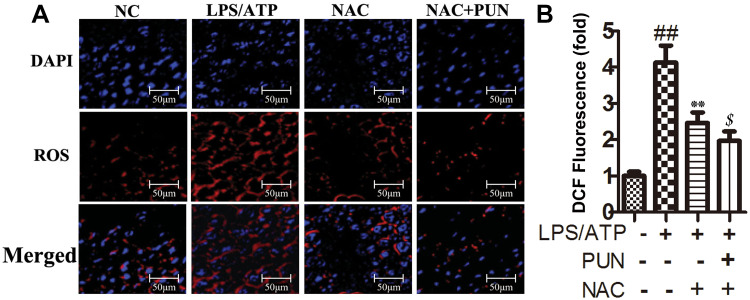
Figure 9.
The intracellular ROS levels. (A) Examined by a fluorescence microscope. (B) The quantified histogram for ROS. ##Indicates P<0.01 vs negative control group. **Indicates P<0.01 vs LPS/ATP stimulated cells group. $Indicates P<0.05 vs NAC plus LPS/ATP stimulated group. J774A.1 cells were pretreated with NAC (10 mM) or PUN (100 μM) +NAC (10 mM), followed by treated with LPS for 5.5 h, ATP for half an hour.

