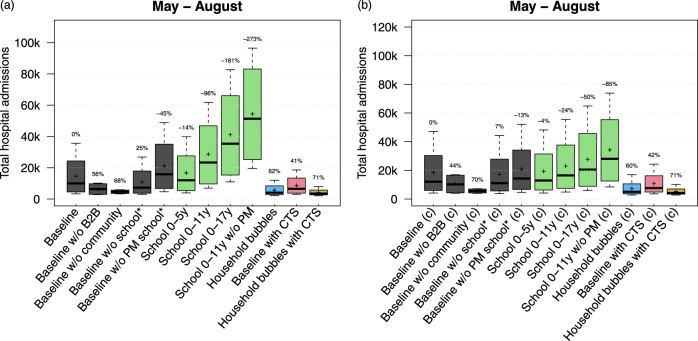
Fig. 5. Impact of location-specific re-openings and age-specific susceptibility.
Total hospital admissions per scenario from May to August assuming that children between 0 and 17 years are equally susceptible as adults (a) or only half as susceptible compared to adults (b). The results are presented as the median (line), quartiles (box), 2.5 and 97.5 percentiles (whiskers) and average (cross) of 40 model realisations (i.e., ten stochastic runs for each of the four social contact behaviour assumptions). The percentages on top of the whiskers indicate the average reduction in hospital admissions with respect to the baseline. CTS contact tracing strategy, w/o without, PM precautionary measures at school.

