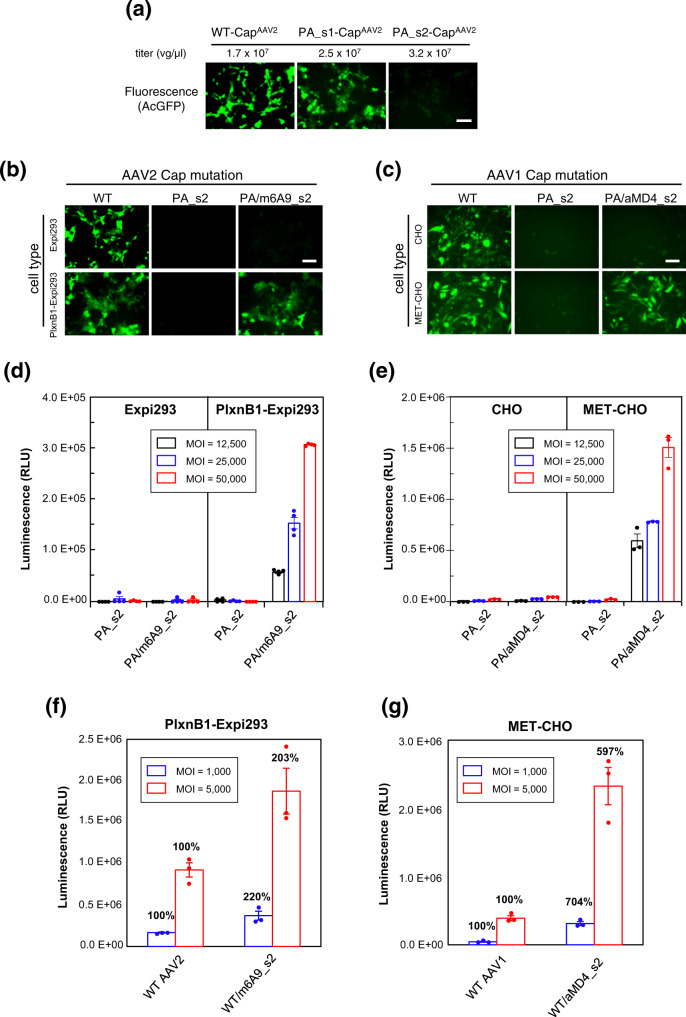
Fig. 6. Peptide grafting onto AAV capsids enables acquisition of different cellular tropism.
a Effect on capsid function from PA tag insertion into AAV2 Cap VP3 at loops s1 or s2. AcGFP-containing AAV2 with either wild-type (WT) or mutant capsids (PA_s1 and PA_s2) were recombinantly produced in AAVpro 293T cells and their titers were measured by qPCR (indicated above each panel). The virus stocks were then used to infect adherent Expi293F cells at MOI = 6 × 10⁵ vg/cell. Fluorescent micrographs are shown for the cells after 48 h of infection. Scale bar, 100 µm. b, c Receptor-dependent gene transduction with mutant AAV2 (b) or AAV1 (c). For PlexnB1-dependent transduction, cells stably expressing PlxnB1 or the parent cells were infected with wild-type (WT) or one of the two mutant AAV2 particles containing an AcGFP gene at an MOI of 6 × 10⁵ vg/cell and then imaged after 24 h. For MET-dependent transduction, unmodified CHO cells or MET-overexpressing CHO cells were infected with WT or mutant AAV1 particles at an MOI of 5 × 10⁴ vg/cell, and photographed after 48 h. The PA_s2 mutant virus contains PA tag at the S2 site on all capsid subunits, while the chimeras (PA/m6A9_s2 or PA/aMD4_s2) contain PlxnB1-binding m6A9 peptide or MET-binding aMD4 peptide at the same site in a fraction of capsid subunits. Scale bar, 100 µm. d, e Transduction with AAV-Luc. Indicated cells were infected with AAV2 (d) or AAV1 (e) capsid mutants carrying a luciferase reporter gene at varying MOI values. The cells were then analyzed for the luciferase activity after 48 h. f, g Enhancement of the gene transduction efficiency of the WT AAVs by additional presentation of receptor-specific peptides. PlxnB1-expressing Expi293F cells (f) or MET-expressing CHO cells (g) were infected with either WT viruses or chimeric viruses bearing m6A9 or aMD4 peptides at the s2 site at MOI of 1000 (blue bars) or 5000 (red bars) and measured for the luciferase activity. The relative transduction efficiency of each mutant virus compared to the WT virus in each condition is shown above the bar. Data are reported as the mean ± SD of n = 4 (for d) and n = 3 (for e–g) technical replicates from a representative experiment out of 9 (d) or 2 (e–g) independent ones. Source data are provided as a Source Data file.

