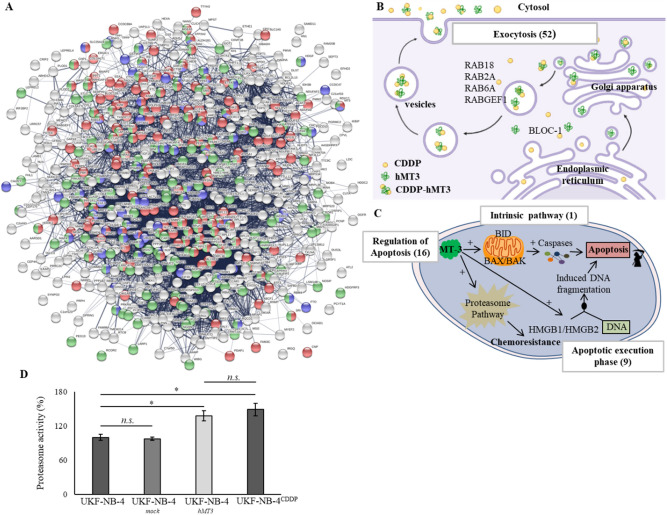
Figure 5.
(A) STRING interactome network showing the proteins, which were found exclusively expressed and up-regulated in UKF-NB-4hMT3 cells compared to mock cell line. These are involved in transport (red nodes), cellular response to stress (blue nodes) and negative regulation of biological process (green nodes), respectively. The colour of the line provides evidences of the different interactions among proteins. A red line indicates the presence of fusion evidence; a green line, neighbourhood evidence; a blue line, concurrence evidence; a purple line, experimental evidence; a light blue line, database evidence; a black line, co-expression evidence. Schematic description of (B) vesicles-mediated transport and membrane trafficking, and (C) apoptotic pathways. The numbers in brackets indicate amount of proteins, which were identified exclusively deregulated due to hMT3 overexpression in UKF-NB-4 cells compared to mock cells. RAB: member RAS oncogene GTPases, BLOC-1: Biogenesis Of Lysosomal Organelles Complex 1, BID: BH3 Interacting Domain Death Agonist, BAX: BCL2 Associated X, BAK: BCL2 Antagonist/Killer, and HMGB1/2: High Mobility Group Box). (D) Proteasome activity analysed in parental UKF-NB-4 cells compared to UKF-NB-4mock, UKF-NB-4hMT3 and UKF-NB-4CDDP cells. The data are results from three (n = 3) independent experiments. *p < 0.01, n.s., not significant.

