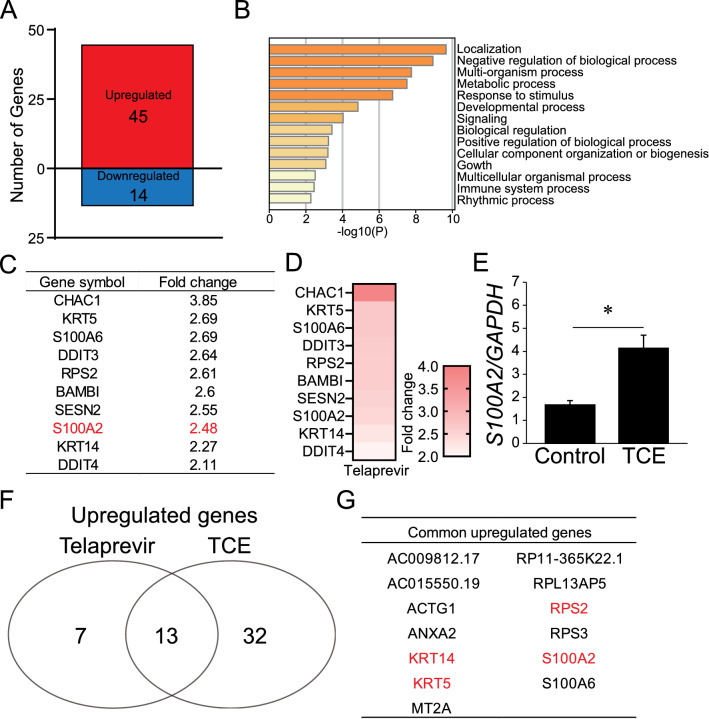
Figure 2.
The expression of S100A2 in TCE-treated keratinocytes. (A) Microarray analysis of the dysregulated genes in keratinocytes after TCE treatment. (B) GO enrichment analysis of upregulated genes in TCE-treated keratinocytes. (C,D) The list (C) and heat map (D) of top 10 upregulated genes in keratinocytes by TCE. (E) The number of common upregulated genes in telaprevir- and TCE-treated keratinocytes. (F) The list of common upregulated genes in telaprevir- and TCE-treated keratinocytes. Four common upregulated genes within the top 10 lists in both telaprevir and TCE groups are highlighted in red. Results are expressed as the mean ± SD. p-values were obtained by the Student’s t-test: *p < 0.05.

