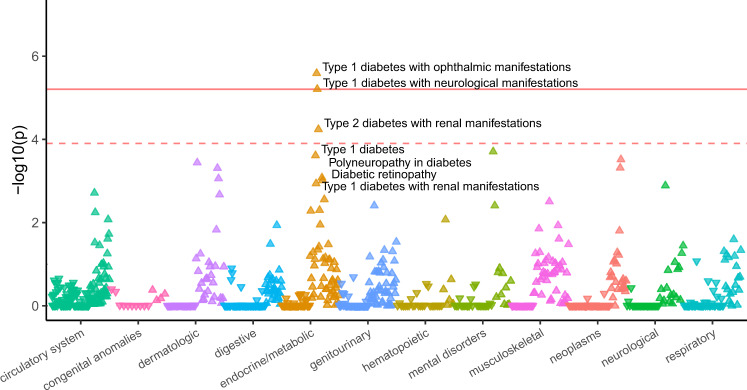
Fig. 4. Phenome-wide association study (PheWAS) of predicted stop-strengthening variant in a translated uORF in PMVK.
PheWAS plot of translated uORF stop-strengthening variant in the 5′UTR of PMVK (N = 65 carriers) in the Penn Medicine BioBank. ICD-9 and ICD-10 Phecodes are organized and plotted by category on the X-axis. Each point represents a single Phecode. The height of each point corresponds to the −log10(P value) of the association between the variant and Phecode using a logistic regression model adjusted for age, age2, sex, and the first ten principal components (PCs) of genetic ancestry. The solid red line represents the threshold for Bonferroni-adjusted significance (P = 6.25e–6) and the red dashed line represents the FDR < 0.10 threshold (P = 1.25e-4) accounting for multiple comparisons. The direction of each arrowhead corresponds to increased risk (up) or decreased risk (down).

