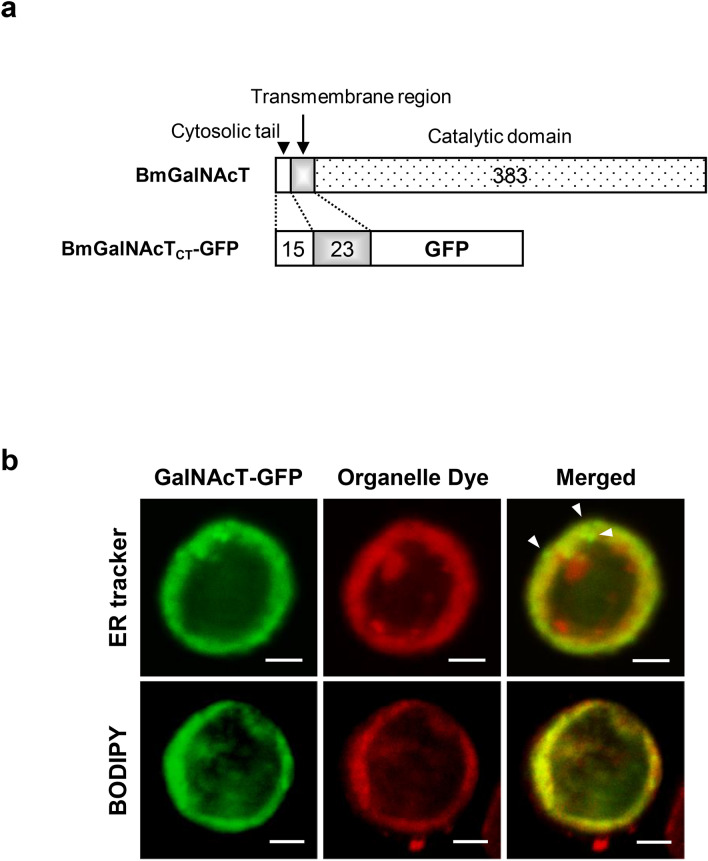
Figure 1.
Subcellular localization of BmGalNAcT. (a) Schematic representation of the fusion protein of BmGalNAcTCT-GFP. The putative cytosolic and transmembrane regions were fused to the N-terminus of GFP. Black dotted, gray, and white boxes indicate the putative cytosolic region, transmembrane region, and catalytic region including the stem region of BmGalNAcT. The numbers indicate the length of each region. (b) Dual-color-imaging of BmGalNAcTCT-GFP-expressing Sf9 cells stained with organelle dyes. (Top) Imaging of BmGalNAcTCT-GFP-expressing cells stained with ER marker. BmGalNAcTCT-GFPs without overlapping ER marker are indicated by white triangles (bottom) Imaging of BmGalNAcTCT-GFP expressing cells stained with BODIPY TR Ceramide as Golgi marker. Bars: 10 μm.

