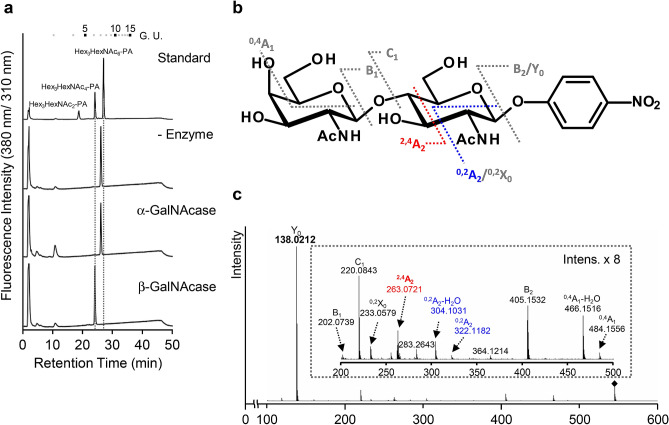
Figure 3.
Linkage analysis of the reaction product. (a) Linkage-specific N-acetylgalactosaminidase digestion of the reaction product. The reaction product purified by SF-HPLC were digested independently by two N-acetylgalactosaminidases specific for α- and β- linkage. The digested products were separated by SF-HPLC. Numbers at the top represent the elution positions of glucose units. (b) Structural representation and fragmentation scheme of GalNAcβ1,4-GlcNAc-pNP. Diagnostic ions are represented in gray characters. (c) Negative ion MS/MS fragmentation spectra of N-acetylgalactosaminylated GlcNAc-pNP. The corresponding m/z values of the CID-derived fragment ions and their nomenclatures are assigned in the spectra. The small window shows the enlarged fragment ions in the mass range m/z 200–500. m/z values shown in black and gray indicate 1,4-linked specific and GalNAcβ-GlcNAc-pNP signals, respectively.

