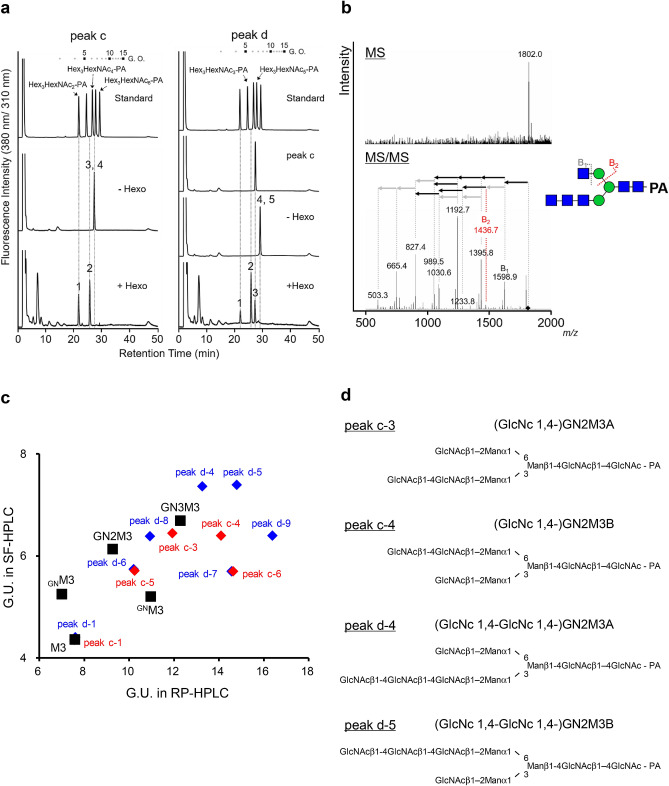
Figure 5.
Structural determination of N-acetylglucosaminylated sugar chains. (a) SF-HPLC analysis of N-acetylhexosaminidase-digested peaks c and d. (b) MS and MS/MS analysis of peak d-4. The putative structure of peak d-4, fragmentation scheme, and diagnostic ions are represented. (c) Two-dimensional mapping of peak c, hexosaminidase-digested peak c, peak d, hexosaminidase-digested peak d, and authentic PA-sugar chains. Elution positions were calculated from the glucose unit in RP-HPLC and SF-HPLC. The red diamond, blue diamond, and black box indicate peak c, peak d in Figure, their N-acetylhexosaminidase (HEXO)-digested products, and the authentic PA-sugar chain, respectively. (d) Deduced structures of N-acetylglucosaminylated GN2M3.

