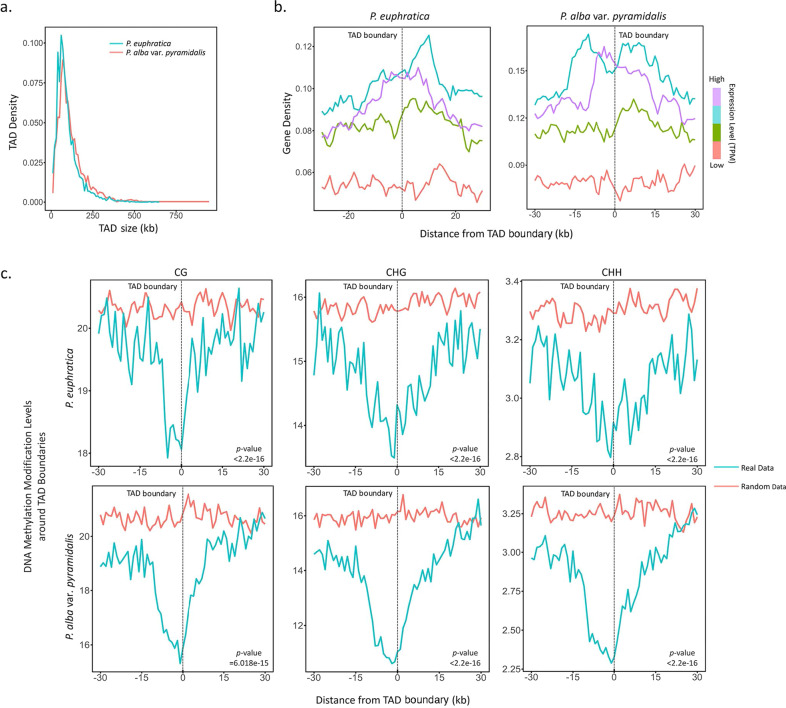
Fig. 2. TAD profiles of P. euphratica and P. alba var. pyramidalis.
a Size distribution of TADs of P. euphratica and P. alba var. pyramidalis at 10-kb resolution. b Density of genes with different expression levels (TPM) around TAD boundaries (±30 kb, window size = 1000 bp) in P. euphratica (left) and P. alba var. pyramidalis (right). Genes were divided into four groups based on the number of transcripts per kilobase of exon model per million mapped reads (TPM), and curves were color-coded based on these groups. c Distribution of DNA methylation levels (CG, CHG, and CHH) around TAD boundaries (±30 kb window size = 1000 bp) in P. euphratica and P. alba var. pyramidalis. The y-axis indicates the methylation level

