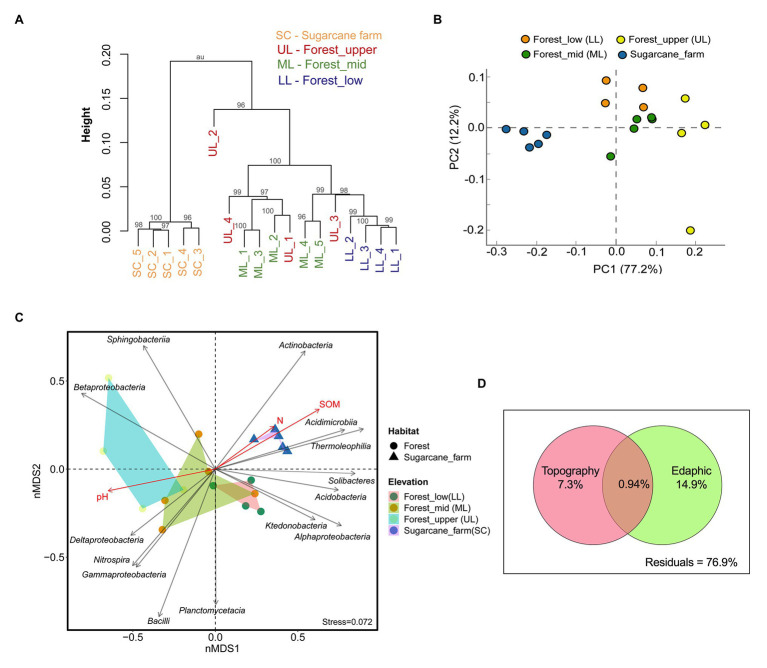
Figure 3.
Beta diversity analysis of bacterial communities under three forest topography types and sugarcane farm. (A) Hierarchical clustering based on operational taxonomic unit (OTU) abundance-based Bray-Curtis similarity coefficients. (B) Principal Component Analysis (PCA) based taxonomic profile at phylum level. (C) Non-metric multidimensional scaling (NMDS) analysis showing relationships among forest and sugar cane farm bacterial community composition at the class level with topography and environment variables. Stress value including ANOSIM test R and p-values are shown at the bottom-left of the plot. (D) Venn diagram representing variation partitioning of bacterial communities explained by forest topography type and edaphic variables.

