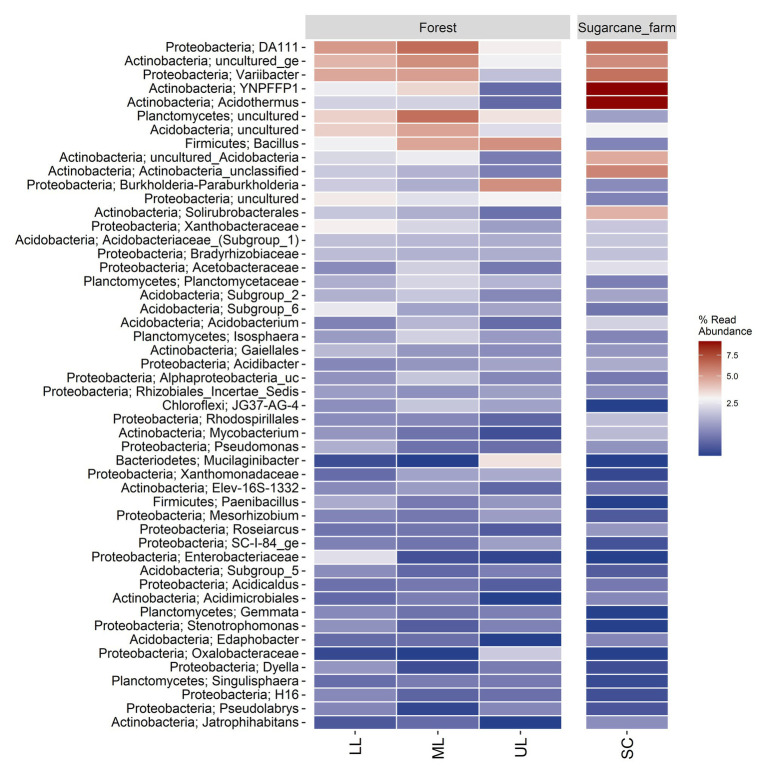
Figure 4.
Percent relative abundance of top 50 genera in the forest topography sites and sugarcane farm (SC). LL, forest_lower; ML, forest_mid; UL, forest_upper; and SC, sugarcane farm. Heatmap was generated by ampvis2 package (Andersen et al., 2018) in R computing environment version 3.5.2.

