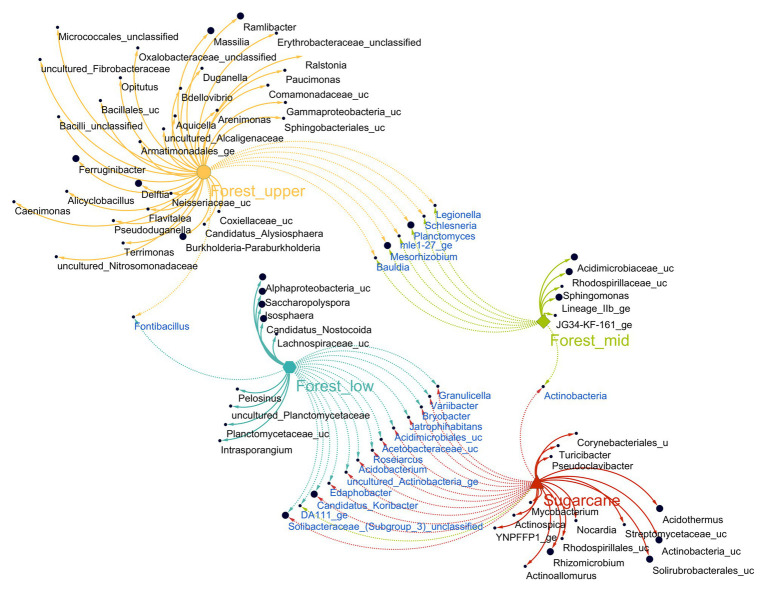
Figure 5.
Association network of significantly abundant soil fungi in different land use systems [multipatt function in indicspecies package in R (Cáceres and Legendre, 2009)]. Node sizes represent the average relative abundance of OTUs in the data sets. Edges represent the association patterns of individual OTUs with the land use systems, and their lengths show the weight of the associations (edge-weighted, spring-embedded layout). The association strength of significant genera is indicated by different edge lengths varying between 0.09 and 0.79.

