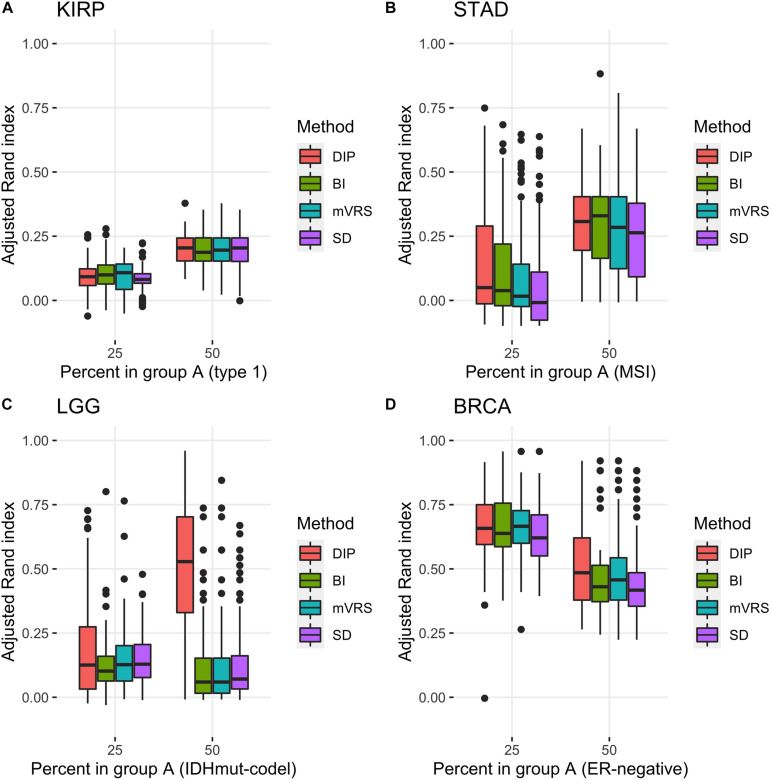
FIGURE 7.
Adjusted Rand index for clustering based on 1000 selected genes with different proportions of the subtypes based on 100 random samplings of the KIRP (A), STAD (B), LGG (C), and BRCA (D) data. The figure shows results for unbalanced data with 25 (75) samples in the smaller (larger) subgroup and for balanced data sets with 50 samples in each subgroup. The selection methods on the x-axis are the dip-test statistic (DIP), bimodality index (BI), the modified variance reduction score (mVRS), and standard deviation (SD).

