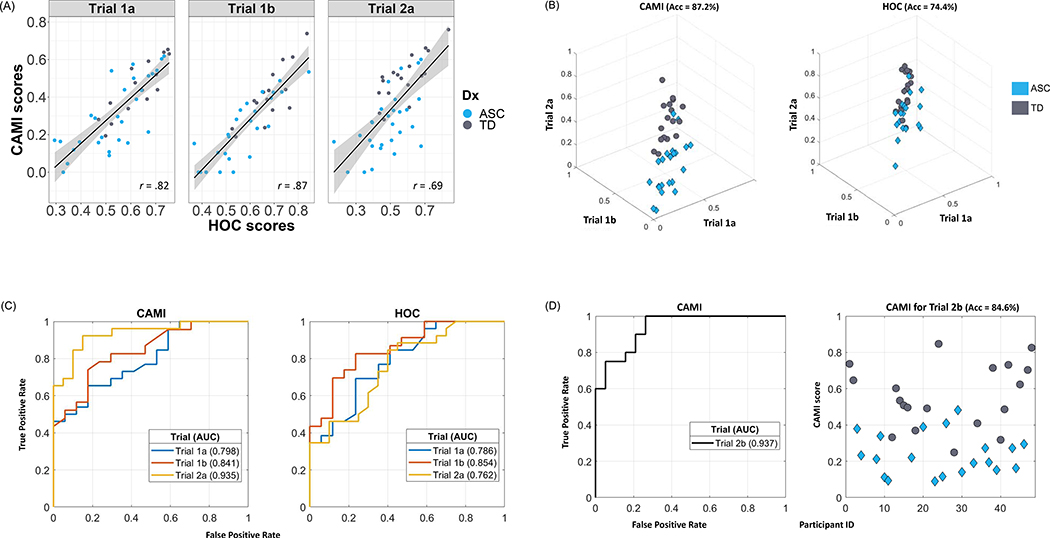
Figure 1. Comparisons between the CAMI and HOC methods using motion data of four imitation trials from a sample of 48 children (27 ASC, 21 TD).
(a) Correlations between the CAMI scores and HOC scores in three trials, showing strong correspondence between the two methods. An r = 1 indicates perfect positive association, r = 0 indicates no association and r = −1 indicates perfect negative association (ps< .0001).
(b) 3D plots of the CAMI scores and HOC scores in which Trial 1a, Trial 1b, and Trial 2a scores correspond to the respective axes. Each marker represents one subject, and the reported accuracy (Acc) corresponds to average classification accuracy in 3-fold cross-validation of a linear SVM classifier (best possible Acc is 100%, meaning all participants categorised to diagnostic groups accurately).
(c) Receiving Operating Characteristic (ROC) curves: true positive rate versus false positive rate as classification threshold is varied. The Area Under the Curve (AUC) indicates the diagnostic ability of the method (left panel for CAMI, right panel for HOC) in each of the three trials (best possible AUC is 1, meaning zero false positives and 100% true positives).
(d) ROC curve (left panel) and CAMI scores (right panel) of Trial 2b only. Since this trial does not have any HOC scores, its CAMI scores are computed based on parameters learnt from the other three trials, complying with the splits used for 3-fold cross-validation. The AUC of the ROC curve (0.937) and SVM accuracy value (84.6%) demonstrate the diagnostic classification ability of CAMI scores with this single trial.

