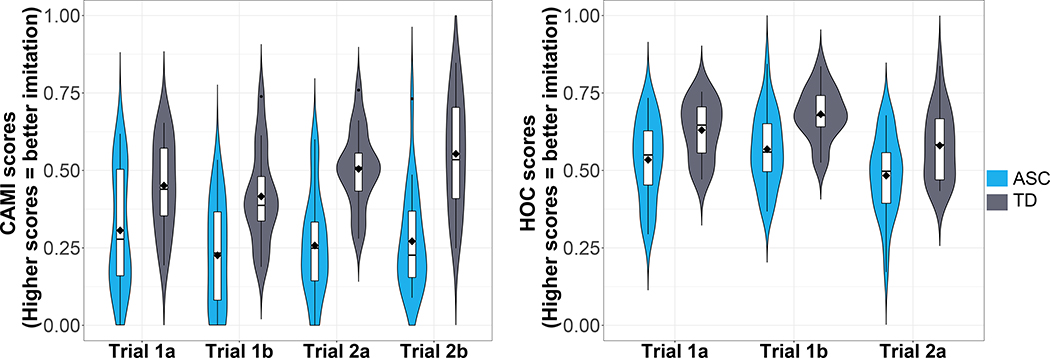
Figure 2.
Imitation performance per diagnostic group (blue = ASC, grey = TD) per trial according to CAMI scores (left) and HOC scores (right) with box plots embedded within violin plots. In the box plots, horizontal lines indicate medians, boxes indicate data within the 25th to 75th percentiles, and whiskers indicate data within the 5th to 95th percentiles.

