Fig. 1.
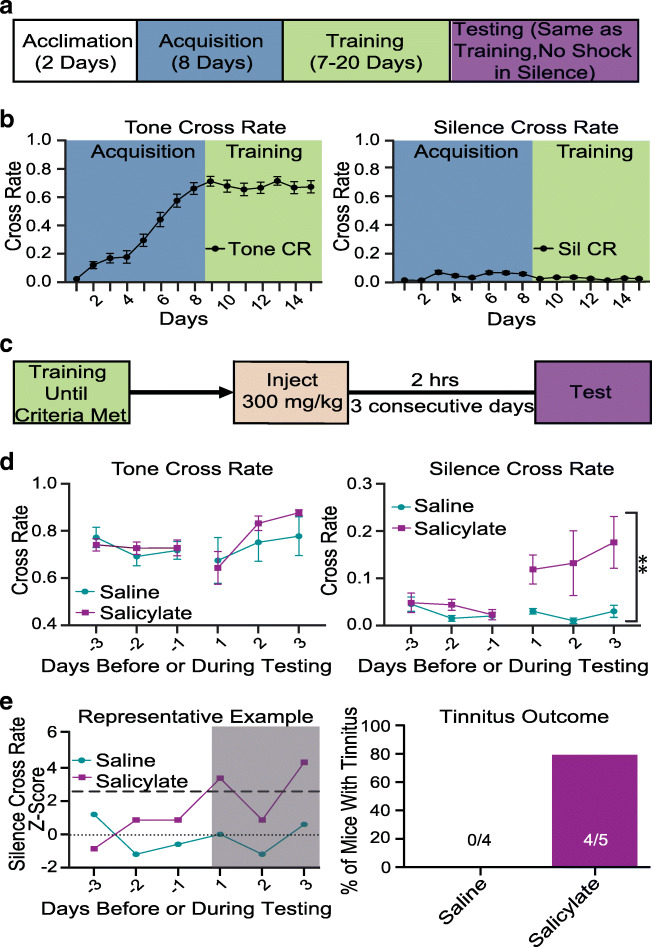
Establishment and validation of tinnitus operant mouse model. a Timeline of the experimental approach. b Tone (left) and silence (right) cross rates during training (N = 16). To quantify this behavior, we used the cross rate (CR), which is the number of trials the mouse crossed over the total number of trials for each task (i.e., if a mouse crosses 40/50 times in tone, tone CR = 0.8). c Timeline of salicylate/saline administration. d Tone (left) and silence (right) in saline vs. salicylate cross rates during training and testing. We used 2-way ANOVA to compare silence CR in saline vs. salicylate: Saline N = 4; salicylate N = 5; F (1,21) = 11.28, P = 0.003. e Example of how tinnitus was assessed using Z-score in individual mice (left) and percentage of mice with tinnitus (right)

