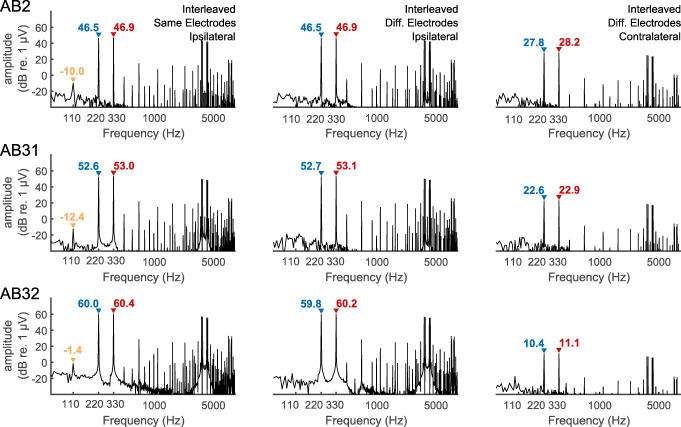
Fig. 4.
FFT of recordings from three subjects implanted with the Advanced Bionics device in response to analogue dyads consisting of component frequencies of approximately F1 = 110 Hz and F2 = 220 Hz. Amplitudes of these primary frequencies are shown in each panel in blue and red text for F1 and F2, respectively. A distortion product at F2-F1 = 110 Hz is observed with an amplitude, indicated in orange text when F1 and F2 are interleaved on the same electrode (left panels) but not when presented separately to different electrodes (right panels). The amplitude of the component at F2-F1 Hz is shown only when significantly greater than the background noise

