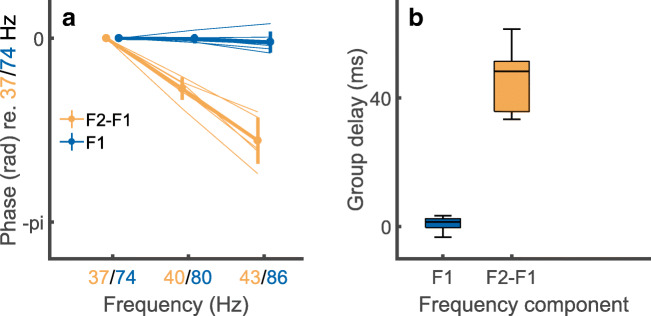
Fig. 6.
A) Phase vs frequency plots for the NDR (F2-F1 Hz, orange) and to an electrical artefact (F1 Hz, blue) in response to interleaved pulse trains having AM rates where F2-F1 is 37, 40, or 43 Hz. The abscissa shows F2-F1 Hz in orange and F1 Hz in blue. Solid lines show average data and faint lines show individual data. B) Box-and-whisker plots showing the group delay, derived from the functions shown in part A, for the NDR (orange) and F1-artefact (blue)

