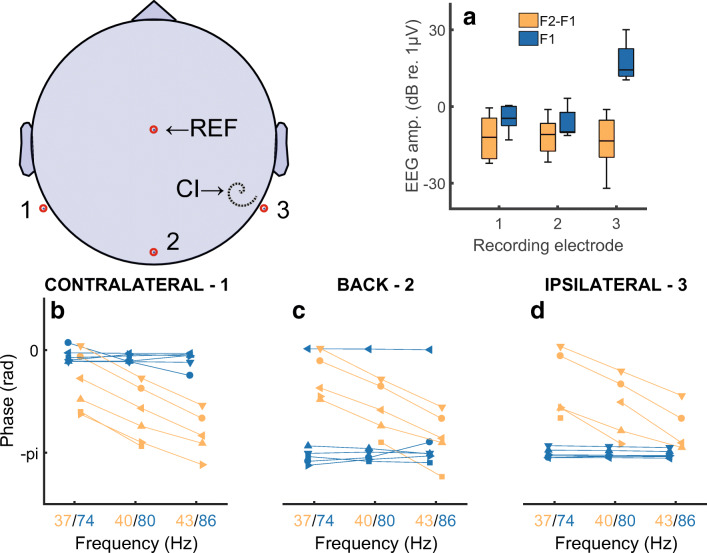
Fig. 7.
Part A) shows the amplitude of the response at the NDR for the NDR (F2-F1 Hz, orange) and to an electrical artefact (F1 Hz, blue) in response to interleaved pulse trains having AM rates such that F2-F1 Hz is close to 40 Hz. Responses are shown for three electrodes illustrated schematically on the left. Electrode 2 was Iz. Electrodes 1 and 3 were P9 and P10 or vice versa, depending on which ear was implanted. Parts B, C, and D show phase vs frequency plots for recording electrodes 1, 2, and 3, respectively. Each of these three plots shows the NDR (F2-F1 Hz, orange) and to an electrical artefact (F1 Hz, blue) in response to interleaved pulse trains having AM rates where F2-F1 is 37, 40, or 43 Hz

