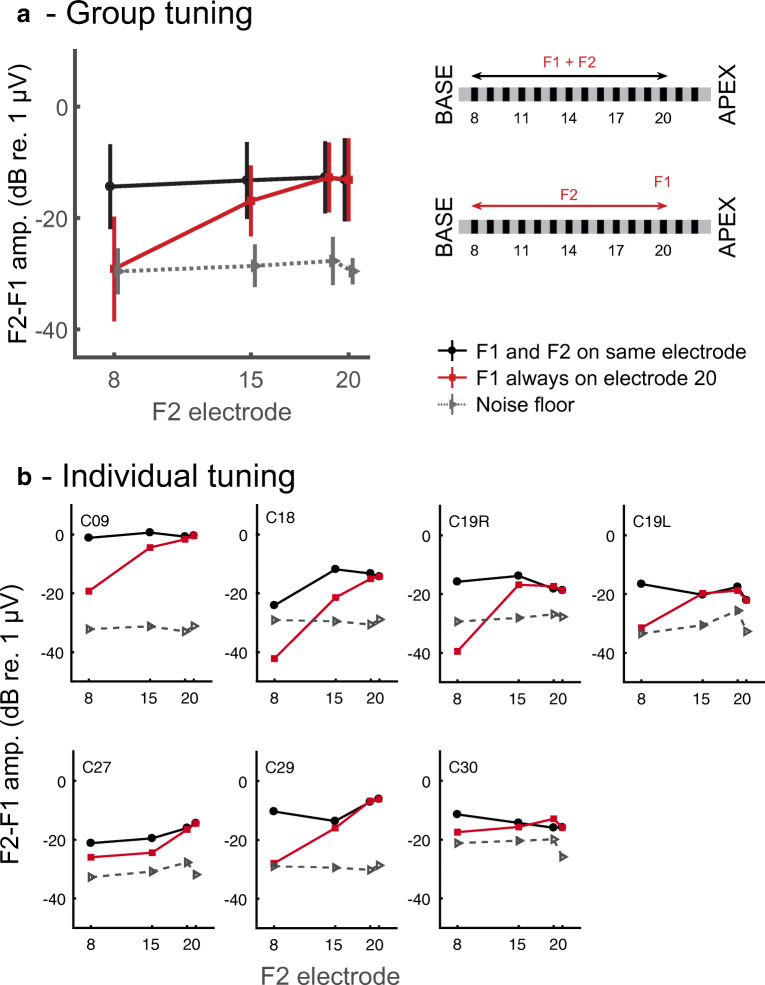
Fig. 8.
A) Average data and schematic of conditions in the spatial selectivity (“tuning”) experiment. The data plot shows the amplitude of the NDR as a function of the electrode that conveys the F2 stimulus. Red lines show the NDR amplitude when F1 is always presented to the most apical electrode tested (usually e20). Black lines show the NDR amplitude when F1 is presented to the same electrode as F2. Grey lines show the noise floor. B) Individual data

