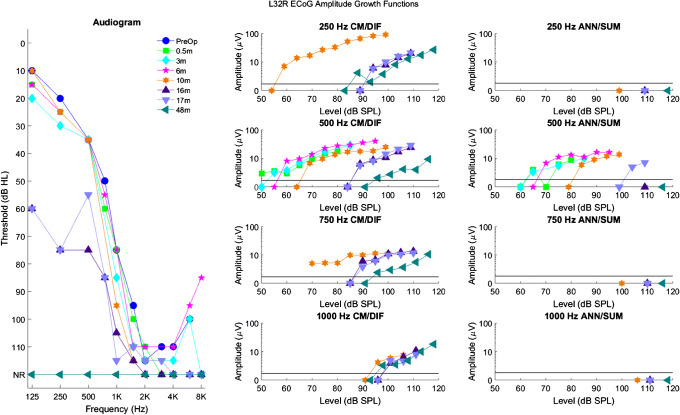
Fig. 3.
Longitudinal audiograms and ECoG amplitude growth functions for subject L32R. The left panel shows serial audiograms from the pre-operative period to 48 months after activation of the CI (NR indicates no response at the limits of the audiometer). The middle and right columns show CM/DIF and ANN/SUM amplitude growth functions for the corresponding time points. The solid line at 1.73 μV represents the noise floor. Each row represents a different frequency from 250 to 1000 Hz. Note that before loss of hearing, CM/DIF and ANN/SUM responses were present. After loss of hearing, only CM/DIF responses were present, but at reduced amplitudes, while ANN/SUM amplitudes were absent

