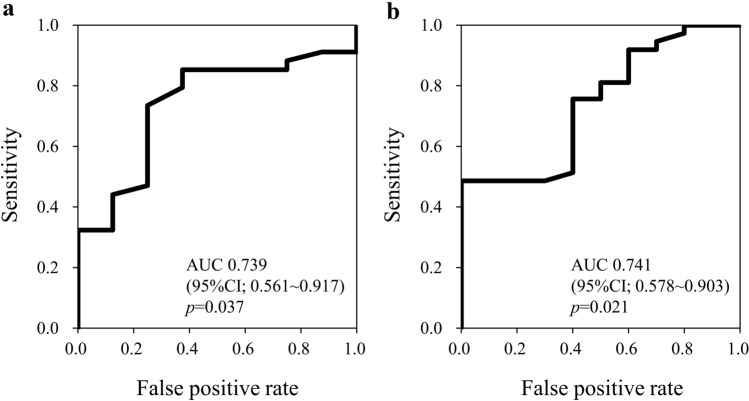
Fig. 3.
ROC curves and area under the curve (AUC) for baseline Ht level to distinguish Ht-elevated or non-elevated group; (a) male cases (n = 42). When the cutoff value of Ht was set to 46.9%, the sensitivity and specificity were 73.5% and 75.0%, respectively; (b) female cases (n = 47). When the cutoff value of Ht was set to 41.7%, the sensitivity and specificity were 75.7% and 60.0%, respectively

