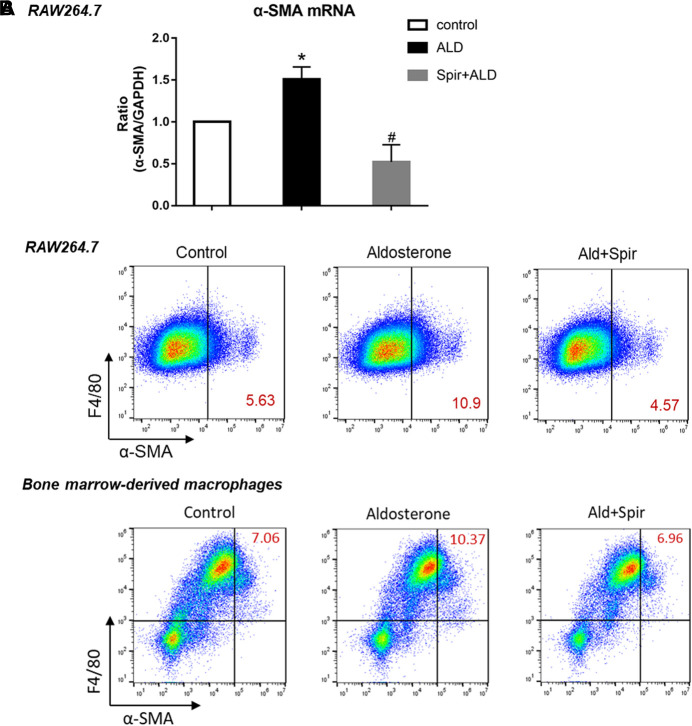
FIGURE 5.
Effects of aldosterone and MR blocker spironolactone (Spir) on the expression of α-SMA in macrophages. (A) mRNA levels expression of α-SMA in cell line macrophages, RAW264.7 cells, treated with or without additional aldosterone and Spir. Data are mean ± SEM. n = 3 independent tests. *p < 0.05 vs. control; #p < 0.05 vs. Aldosterone. (B) Two-color flow cytometry analysis show protein level expression of α-SMA in macrophage cell line (RAW264.7, upper panel) and mouse bone marrow derived macrophages (lower panel). Numbers in red color indicating the percentage of MMT cells with α-SMA+, F4/80+. Data are representative for n = 5–7 independent tests.

