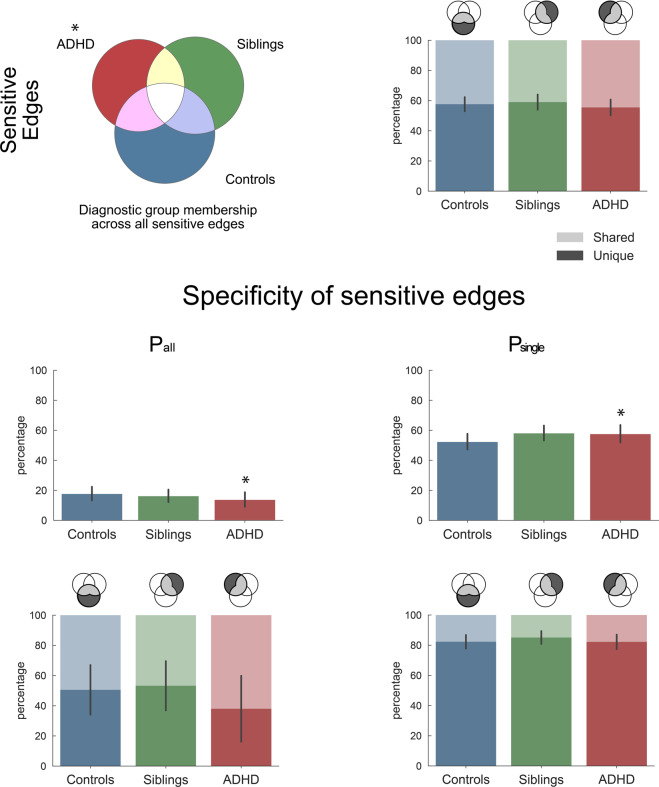
Fig. 1. Sensitivity to task modulation.
Description of total connectivity modulations across the three tasks and diagnostic groups (ADHD, siblings, controls). The first row shows for each group the percentage of connections they modulated across the three tasks (sensitive connections) and within these selected connections, the relative percentage of connections unique to one group or shared across groups. We further split the selected connections of each group into task-specific (Psingle), and common (Pall) connections, corresponding to connections modulated in only one, or all three tasks, respectively. The second row of this figure quantifies the relative percentage of each connection type (Pall and Psingle) within the sensitive connections of each group. For the connections described in the second row, the third row then quantifies whether these connections were unique to that group or shared across groups. Stars indicate significant differences from null distribution after FDR correction (see Table S7). Replication of these findings across possible confounding effects (scanner, gender, medication, comorbidity, age, IQ) is available in Figs. S1 and S2.

